優惠套餐

插圖素材: Thermodynamic infographic diagram illustrating endothermic and exothermic phase change transitions between solid liquid gas states, explaining matter enthalpy dynamics

素材編號 : 141049605 查看全部

Thermodynamic infographic diagram illustrating...[141049605],此圖庫插圖素材具有化學,化學品,化學物的關鍵詞。此插圖素材是Hotaru / (No.2647376)的作品。您可以購買圖像大小從影像尺寸從S至XLUS$5.00以上的尺寸。註冊成為免費會員後,您可以下載帶有浮水印的圖片以確認畫質及使用收藏夾的服務。 查看全部
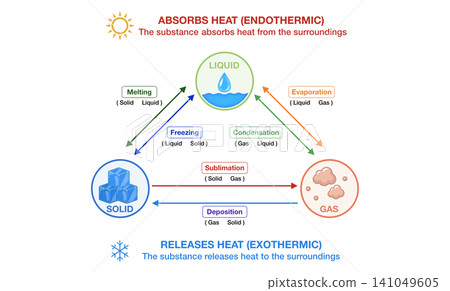
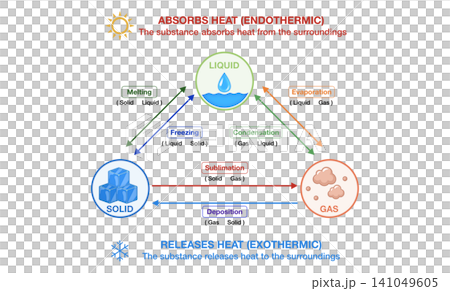
Thermodynamic infographic diagram illustrating endothermic and exothermic phase change transitions between solid liquid gas states, explaining matter enthalpy dynamics 141049605

Thermodynamic infographic diagram illustrating endothermic and exothermic phase change transitions between solid liquid gas states, explaining matter enthalpy dynamics

  • 1:1
  • 4:3
  • 4:5
    (8:10)
  • 3:2(6:4)
  • 自訂
    :

縮放

* 您可以拖曳以移動圖片

S
  • 640 x 386px
  • 22.6 x 13.6cm (72dpi)
JPG+PNG US$5.00
M
  • 2000 x 1207px
  • 16.9 x 10.2cm (300dpi)
JPG+PNG US$15.00
L
  • 4000 x 2415px
  • 33.9 x 20.4cm (300dpi)
JPG+PNG US$30.00
XL
  • 6400 x 3865px
  • 54.2 x 32.7cm (300dpi)
JPG+PNG US$50.00
Ex 追加擴展許可證 +US$30.00
合計:
[免費]編輯素材

只要使用免費編輯工具,
就算尚未購買素材亦可嘗試圖片的編輯、加工
詳細內容請點此確認

插圖素材: Thermodynamic infographic diagram illustrating endothermic and exothermic phase change transitions between solid liquid gas states, explaining matter enthalpy dynamics的關鍵詞